Showing posts with label global warming. Show all posts

Saturday, August 4, 2012

The Not So Mysterious Melting Streetlights of Stillwater

After a recent heat wave in the heartland, someone snapped this picture of melted streetlights in Stillwater, Oklahoma (temperatures reached as high as 115 F):


Immediately, global warming alarmist Bill McKibben took to twitter to blame global warming:
“Senator Inhofe, God may be trying to get your attention. Check out this picture.”
Senator Imhofe's research staff proved up to the challenge and determined the true cause of the melted street lights...


 ...a fire in a dumpster under the lamps. Oops; I'll bet that was embarrassing.

Nope, McKibben turned around and blamed the dumpster fire and Global Warming:
The person who took the photo, Patrick Hunter, described the scene: “Being the person that actually took this photo, I’d say that this was due to a fire semi-close by coupled with the unbelievable heat we are experiencing. Still an amazing photo and not fake as many are saying on here. Enjoy!”
Because nobody ever set a trashcan on fire before...

Incidentally, the globes are reported to be made of high density polyethylene, which melts at approximately 266 F.  It looks to me, though, that they didn't exactly melt, but just softened until they started to slump from their own weight.  Kind of like the plastic siding on my house next to the grill.

Monday, July 30, 2012

US Warming Trend Takes Another Hit

After a couple days of hiatus, Anthony Watts at Watts Up With That, announces the submission of a major paper, which, if generally accepted, will result in cutting the warming trend observed in the US from 1978 to the present from +0.309 C per decade to +.155 C per decade:
U.S. Temperature trends show a spurious doubling due to NOAA station siting problems and post measurement adjustments.
Abstract:
Anthony Watts of California, Evan Jones of New York, Stephen McIntyre of Toronto, Canada, and Dr. John R. Christy from the Department of Atmospheric Science, University of Alabama, Huntsville, is to be submitted for publication.

A reanalysis of U.S. surface station temperatures has been performed using the recently WMO-approved Siting Classification System devised by METEO-France’s Michel Leroy. The new siting classification more accurately characterizes the quality of the location in terms of monitoring long-term spatially representative surface temperature trends. The new analysis demonstrates that reported 1979-2008 U.S. temperature trends are spuriously doubled, with 92% of that over-estimation resulting from erroneous NOAA adjustments of well-sited stations upward. The paper is the first to use the updated siting system which addresses USHCN siting issues and data adjustments.

The new improved assessment, for the years 1979 to 2008, yields a trend of +0.155C per decade from the high quality sites, a +0.248 C per decade trend for poorly sited locations, and a trend of +0.309 C per decade after NOAA adjusts the data. This issue of station siting quality is expected to be an issue with respect to the monitoring of land surface temperature throughout the Global Historical Climate Network and in the BEST network.
Essentially, these scientists contend that the US climate data is seriously contaminated by an artificial warming trend, caused by poorly sited weather stations, which continue to warm as civilization, and it's excess heat and landscape changes encroach on them. Moreover, the homogenization techniques used to normalize data across stations, and changing sites has the effect of magnifying this artifact.  The key figure, below, shows that with badly sited stations included, the higher warming trends are observed across the country; with the poorly sited stations thrown out, the warming is much less.


This is generally consistent with, and complementary to a study of temperature data world wide that also suggested that the normalization process was adding considerably to warming trends over the last century.

Expect vociferous and ad hominem attacks on this study and it's authors.

Wednesday, July 18, 2012

New Study Casts Doubt on Crucial Assumption in Global Warming Models

The warming function of CO2 alone is pretty well understood; it expected to be a little less than a degree C for a doubling of CO2.  However, global climate change models typically have a much higher result, on the order of 3 degrees C, the result of positive feedback from higher amounts of water vapor (a more important greenhouse gas than CO2) which are presumed to result from the higher temperature.  While sensible at first glance, this assumption has been subject to considerable skepticism in the skeptical community, who offer the (also plausible) story that increased water vapor results in greater cloud cover, and increased albedo (reflection of sunlight off the cloud top back into space), reducing the climate sensitivity to CO2.  

Vonder Haar et al 2012, Fig. 4
A new study suggests that, in fact, the role of increased water vapor as a greenhouse gas has been overstated, and the role of cloud formation and the increase in albedo has been missed.

“Weather And Climate Analyses Using Improved Global Water Vapor Observations”
Vonder Haar, T. H., J. Bytheway, and J. M. Forsythe (2012), Weather and climate analyses using improved global water vapor observations,
Geophys. Res. Lett.,doi:10.1029/2012GL052094, in press.

Abstract

The NASA Water Vapor Project (NVAP) dataset is a global (land and ocean) water vapor dataset created by merging multiple sources of atmospheric water vapor to form a global data base of total and layered precipitable water vapor. Under the NASA Making Earth Science Data Records for Research Environments (MEaSUREs) program, NVAP is being reprocessed and extended, increasing its 14-year coverage to include 22 years of data. The NVAP-MEaSUREs (NVAP-M) dataset is geared towards varied user needs, and biases in the original dataset caused by algorithm and input changes were removed. This is accomplished by relying on peer reviewed algorithms and producing the data in multiple “streams” to create products geared towards studies of both climate and weather. We briefly discuss the need for reprocessing and extension, steps taken to improve the product, and provide some early science results highlighting the improvements and potential scientific uses of NVAP-M. The results of Figs. 1 and 4 have not been subjected to detailed global or regional trend analyses, which will be a topic for a forthcoming paper. Such analyses must account for the changes in satellite sampling discussed in the supplement. Therefore, at this time, we can neither prove nor disprove a robust trend in the global water vapor data. “The extended calculation using coupled runs confirms the earlier inference from the AMIP runs that underestimating the negative feedback from cloud albedo and overestimating the positive feedback from the greenhouse effect of water vapor over the tropical Pacific during ENSO is a prevalent problem of climate models.
For a more detailed discussion of this paper by a qualified climate scientist, I suggest you read the discussion at Roger Pielke Sr.'s blog.

Tuesday, July 17, 2012

Half a Century's Global Warming Disappears in One Day

About half of the 0.7 C warming of the last one hundred years appears to be a statistical artifact (see note) caused by the way various data sources are stitched together, or "homogenized"

The abstract:
We investigate the methods used for the adjustment of inhomogeneities of temperature time series covering the last 100 years. Based on a systematic study of scientific literature, we classify and evaluate the observed inhomogeneities in historical and modern time series, as well as their adjustment methods. It turns out that these methods are mainly statistical, not well justified by experiments and are rarely supported by metadata. In many of the cases studied the proposed corrections are not even statistically significant.

From the global database GHCN-Monthly Version 2, we examine all stations containing both raw and adjusted data that satisfy certain criteria of continuity and distribution over the globe. In the United States of America, because of the large number of available stations, stations were chosen after a suitable sampling. In total we analyzed 181 stations globally. For these stations we calculated the differences between the adjusted and non-adjusted linear 100-year trends. It was found that in the two thirds of the cases, the homogenization procedure increased the positive or decreased the negative temperature trends.

One of the most common homogenization methods, ‘SNHT for single shifts’, was applied to synthetic time series with selected statistical characteristics, occasionally with offsets. The method was satisfactory when applied to independent data normally distributed, but not in data with long-term persistence.

The above results cast some doubts in the use of homogenization procedures and tend to indicate that the global temperature increase during the last century is between 0.4°C and 0.7°C, where these two values are the estimates derived from raw and adjusted data, respectively.
It's been observed by the skeptical community for some time that the "adjustments" to temperatures, based on homogenization of the data have largely acted to warm the present or cool the past, both of which lead to an appearance of greater warming.  This paper suggests that the fault lies with the statistical methods employed, and perhaps not with the wishes of the homogenizers. Let's give them the benefit of the doubt, for now.

Found at Watts Up With That.

Artifact: An inaccurate observation, effect, or result, especially one resulting from the technology used in scientific investigation or from experimental error: The apparent pattern in the data was an artifact of the collection method.

Saturday, July 14, 2012

It's So Hot in Florida

That the bikini girls are fainting.


Wombat-Soccho hit his self imposed Sunday deadline with "Burning Photographs" and Rule 5s at The Other Mccain.

Tuesday, July 10, 2012

The Strange Case of Global Warming

Nobel Prize winning physicist Ivar Giaever answers the question: "Is Global Warming a Pseudoscience?"  The volume on this clip is awfully low, so turn it up; it's worth it.


In short, his answer is "Yes!"

Saturday, June 23, 2012

Please, Call Me a Skeptic, Not a "Denier"

Nature (one of the worlds leading scientific journals) recently published an article by Bain et al entitled "Promoting pro-environmental action in climate change deniers." "Deniers" is a word climate "Apocalyptics" have chosen to use widely, to try to equate people who question their vision of a burning planet unless we knuckle under to their deindustrialization and global social justice agenda with folk who deny the existence of the Nazi Holocaust in WWII.  This is the first real breakthrough for this sort of language into the scientific literature, which is ordinarily supposed to be more circumspect about calling their academic opponents names.

Push back was essentially instantaneous, and it produced this response from the lead authors:
...Comments about the use of the “denier” label are a fair criticism. We were focused on the main readership of this journal – climate scientists who read Nature journals, most of whom hold the view that anthropogenic climate change is real. It should also be noted that describing skepticism as denial is a term increasingly used in the social science literature on climate change (e.g. in Global Environmental Change, Journal of Environmental Psychology, Routledge Handbook of Climate Change and Society), and is used informally by some within the climate science community. So we were using a term that is known, used, and understood in the target audience, but which we thought involved a stronger negative stereotype (e.g. being anti-environmental, contrarian) than skeptic. My thought was this would highlight the contrast with the data, which suggests that you need not believe in AGW to support pro-environmental action, especially when it had certain types of (non-climate) outcomes (demonstrating a non-contrarian position). So in my mind we were ultimately challenging such “denier” stereotypes. But because we were focused on our target audience, it is true that I naively didn’t pay enough attention to the effect the label would have on other audiences, notably skeptics. Although I hope this helps explain our rationale for using the term, I regret the negative effects it has had and I intend to use alternative labels in the future...
And it still deserves a serious response, lest this become the scientific standard.  The following is an excerpt from a response to Bain from Dr. Robert G. Brown of Duke University:
...Let me tell you in a few short words why I am a skeptic. First of all, if one examines the complete geological record of global temperature variation on planet Earth (as best as we can reconstruct it) not just over the last 200 years but over the last 25 million years, over the last billion years — one learns that there is absolutely nothing remarkable about today’s temperatures! Seriously. Not one human being on the planet would look at that complete record — or even the complete record of temperatures during the Holocene, or the Pliestocene — and stab down their finger at the present and go “Oh no!”. Quite the contrary. It isn’t the warmest. It isn’t close to the warmest. It isn’t the warmest in the last 2 or 3 thousand years. It isn’t warming the fastest. It isn’t doing anything that can be resolved from the natural statistical variation of the data. Indeed, now that Mann’s utterly fallacious hockey stick reconstruction has been re-reconstructed with the LIA and MWP restored, it isn’t even remarkable in the last thousand years!
Earth's temperature history medium term, from Antarctica

Furthermore, examination of this record over the last 5 million years reveals a sobering fact. We are in an ice age, where the Earth spends 80 to 90% of its geological time in the grip of vast ice sheets that cover the polar latitudes well down into what is currently the temperate zone. We are at the (probable) end of the Holocene, the interglacial in which humans emerged all the way from tribal hunter-gatherers to modern civilization. The Earth’s climate is manifestly, empirically bistable, with a warm phase and cold phase, and the cold phase is both more likely and more stable. As a physicist who has extensively studied bistable open systems, this empirical result clearly visible in the data has profound implications. The fact that the LIA was the coldest point in the entire Holocene (which has been systematically cooling from the Holocene Optimum on) is also worrisome. Decades are irrelevant on the scale of these changes. Centuries are barely relevant. We are nowhere near the warmest, but the coldest century in the last 10,000 years ended a mere 300 years ago, and corresponded almost perfectly with the Maunder minimum in solar activity.
Earth's recent temperature history as recorded in Greenland

There is absolutely no evidence in this historical record of a third stable warm phase that might be associated with a “tipping point” and hence “catastrophe” (in the specific mathematical sense of catastrophe, a first order phase transition to a new stable phase). It has been far warmer in the past without tipping into this phase. If anything, we are geologically approaching the point where the Earth is likely to tip the other way, into the phase that we know is there — the cold phase. A cold phase transition, which the historical record indicates can occur quite rapidly with large secular temperature changes on a decadal time scale, would truly be a catastrophe. Even if “catastrophic” AGW is correct and we do warm another 3 C over the next century, if it stabilized the Earth in warm phase and prevented or delayed the Earth’s transition into cold phase it would be worth it because the cold phase transition would kill billions of people, quite rapidly, as crops failed throughout the temperate breadbasket of the world...
I wish I'd have said that (and I have said parts of it many times, but not that well). As they say, read the whole thing.

Wednesday, June 20, 2012

Thursday, June 14, 2012

Did a Cosmic Triple Whammy Wipe Out Clovis?

An 18-member international team of researchers that includes James Kennett, professor of earth science at UC Santa Barbara, has discovered melt-glass material in a thin layer of sedimentary rock in Pennsylvania, South Carolina, and Syria. According to the researchers, the material –– which dates back nearly 13,000 years –– was formed at temperatures of 1,700 to 2,200 degrees Celsius (3,100 to 3,600 degrees Fahrenheit), and is the result of a cosmic body impacting Earth.

Looks like a Clovis point to me...
These new data are the latest to strongly support the controversial Younger Dryas Boundary (YDB) hypothesis, which proposes that a cosmic impact occurred 12,900 years ago at the onset of an unusual cold climatic period called the Younger Dryas. This episode occurred at or close to the time of major extinction of the North American megafauna, including mammoths and giant ground sloths; and the disappearance of the prehistoric and widely distributed Clovis culture. The researchers’ findings appear today in the Proceedings of the National Academy of Sciences.

“These scientists have identified three contemporaneous levels more than 12,000 years ago, on two continents yielding siliceous scoria-like objects (SLO’s),” said H. Richard Lane, program director of National Science Foundation’s Division of Earth Sciences, which funded the research. “SLO’s are indicative of high-energy cosmic airbursts/impacts, bolstering the contention that these events induced the beginning of the Younger Dryas. That time was a major departure in biotic, human and climate history.”


There have even been theories introduced that the Clovis culture is related to a similar stone tool set called Solutrean, found in Europe, which opens the possibility that the Clovis culture was brought by people who navigated the ice margin in the Atlantic. Recent finds  give tantalizing evidence for pre-Clovis artifacts, but sadly the hypothesis remains unconfirmed.

Several theories have been advanced to explain the Younger Dryas:

A change in Atlantic circulation due to in influx of fresh water from "Lake Agassiz" in the wake of the receding continental glaciers,

A change in rainfall due to the change in atmospheric patterns as the ice melted,

An extreme solar flare; much larger than the Carrington Event,

A Volcanic eruption touching off a "nuclear winter",

The impact of an extraterrestrial body (meteorite or comet) which caused a "nuclear" winter type event.

These findings substantially boost the last hypothesis.  Proved?  Not yet.

Could it be that a meteorite strike (or rather, multiple strikes from a large body), was the death knell of a population of early North Americans with their roots in Europe rather than Asia?  Stand by for more .


Wednesday, June 13, 2012

North Carolina Goes With Science

A long guest post over at Watts Up With That, about how a group of citizens, including scientists persuaded legislators to actually look at the science of sea level rise, and not base their regulations on a single model that predicted a high rate of sea level rise in the future.
In this case, SLR legislation was drafted by a staffer who has a PhD in oceanography. The main point of the document was that future SLR projections must be made based on extrapolating prior empirical data. In other words, state agencies would not be allowed to create policies that were based on speculations about some possible acceleration!
I can't effectively excerpt this, go I suggest you read the original.

Tuesday, June 12, 2012

Lawmakers Intimidated Out of Inflammatory Language

State lawmakers ran into a problem this year when recommending a study on rising sea levels and their potential impacts on coastal Virginia.

It was not a scientific problem or a financial one. It was linguistic.

They discovered that they could not use the phrases "sea level rise" or "climate change" in requesting the study, in part because of objections from Republican colleagues and also for fear of stirring up conservative activists, some of whom believe such terms are liberal code words.

On its website, for example, the Virginia tea party described the proposed "sea level rise" study this way: "More wasted tax dollars for more ridiculous studies designed to separate us from our money and control all land and water use."

The group urged its members to contact elected officials right away to defeat the measure: "They will pass this without blinking if we don't yell loudly."

So lawmakers did away with all mention of sea level rise, substituting a more politically neutral phrase: "recurrent flooding."
 I'll be the first to admit there is "sea level rise", at least in the medium term (meaning a few years duration).  Sea level has been rising since the end of the last ice-age, more than 10,000 years ago.  In the last few years, it has slackened some, but not ceased.  Around the world, ancient coastal cities have been drowned.

It was recently brought home to me when the newly repaired docks at Flag Harbor were raised 11 inches.  I was thinking that was a lot, until I did the math.  The docks were installed in the 1980s.  Since then, at the current rate of Chesapeake Bay sea level rise of about 4 mm a year, the Bay has risen about 160 mm, or about 6 inches.  If the docks last another 40 years, sea level rise will bring them back to roughly the height above high water as they were in 1980.

But, that's how man adapts.  We did it on our own, with our own money, when we need to. We don't need the government to claim a special right to manage the coastal and enforce their collective vision of how we should handle it.
The amended study, while fixed on the same research, sailed through the General Assembly and was signed by Gov. Bob McDonnell, who also has raised questions about what is causing slightly higher temperatures on the planet.

The episode illustrates the continuing, even increasing, volatility of climate change as a policy issue in Virginia, at the same time that other states and whole nations are moving forward with plans to combat the phenomenon.

It also shows how climate skeptics, through their political connections and organization, are forcing state and local government to stay clear of certain buzzwords in quietly pursuing a strategy, else they risk unleashing a brawl.

Government officials and scientists just shrug when asked about the language games, especially when the subject is sea level rise. To them, the debate should not be about what is causing waters to slowly rise, but what should be done about it.

"These studies need to be done if we're going to logically tackle these problems that scientific data unequivocally proves are happening," said Larry Atkinson, an oceanographer at Old Dominion University who is overseeing a climate change initiative that focuses on rising sea levels.

"So, whatever we have to call it, I've got no problem with that," he added. "What's the alternative? Do nothing?"

The semantics dance harkens to the days when "global warming" was commonly uttered. But after conservatives criticized and ridiculed Al Gore and others, "climate change" became the kinder, gentler way to communicate the same thing.

Now it appears that "climate change" and "sea level rise" are being phased out, in Virginia at least, amid political pressure from the far right. Emerging labels include "increased flooding risk," "coastal resiliency" and, of course, "recurrent flooding."
GISS Monthly Mean Surface Temperature Anomaly – 1996 to Present
And there's a reason that the term "global warming is a misnomer.  The global hasn't warmed since 1998.  See the NOAA data on the right.
State Del. Chris Stolle, R-Virginia Beach, who insisted on changing the "sea level rise" study in the General Assembly to one on "recurrent flooding," said he wants to get political speech out of the mix altogether.

He said "sea level rise" is a "left-wing term" that conjures up animosities on the right. So why bring it into the equation?

"What people care about is the floodwater coming through their door," Stolle said. "Let's focus on that. Let's study that. So that's what I wanted us to call it."
Put the house on stilts, or move it back up the hill, but don't ask the government to control it, because it won't.

Tuesday, May 8, 2012

Good News, Food to Still be Plentiful in 18 years!

Obesity could affect 42% of Americans by 2030
The new projection, released here Monday, warns that 42% of Americans may end up obese by 2030, and 11% could be severely obese, adding billions of dollars to health care costs.

"If nothing is done (about obesity), it's going to hinder efforts for health care cost containment," says Justin Trogdon, a research economist with RTI International, a non-profit research organization in North Carolina's Research Triangle Park.

"The obesity problem is likely to get much worse without a major public health intervention," says Eric Finkelstein, a health economist with Duke University Global Health Institute and lead researcher on the new study.
I guess the modellers have predicted that the bad effects of global warming climate change will not have kicked in by then, and killed all the crops.

And of course, this calls for the government to put us all on a diet.

UPDATE:  A timely rant by Ace; Read the whole thing
Americans are too fat. They ought not be fat.

But it is far more important that they be free than they be thin.

Obligatory Dinosaur Flatus Post

Professor Graeme Ruxton of St Andrews University, Scotland, said the giant animals spent 150 [million] years emitting the potent global warming gas, methane.

Large plant-eating sauropods would have been the main culprits because of the huge amounts of greenery they consumed.

The team calculated the animals would have collectively produced more than 520m tons of methane a year – more than all today’s modern sources put together.

It is thought these huge amounts could easily have been enough to warm the planet.
You must be shitting putting me on.  What kind of error bars did you put on those estimates?

 And to think I thought I could get away without posting a pretty girl:


OK, who farted?

Thanks to Wombat-Socho for taking my early submissions for the weekly Rule 5 link around at The Other McCain's "I Need to Know".

Thursday, May 3, 2012

What's Up With the Sun?

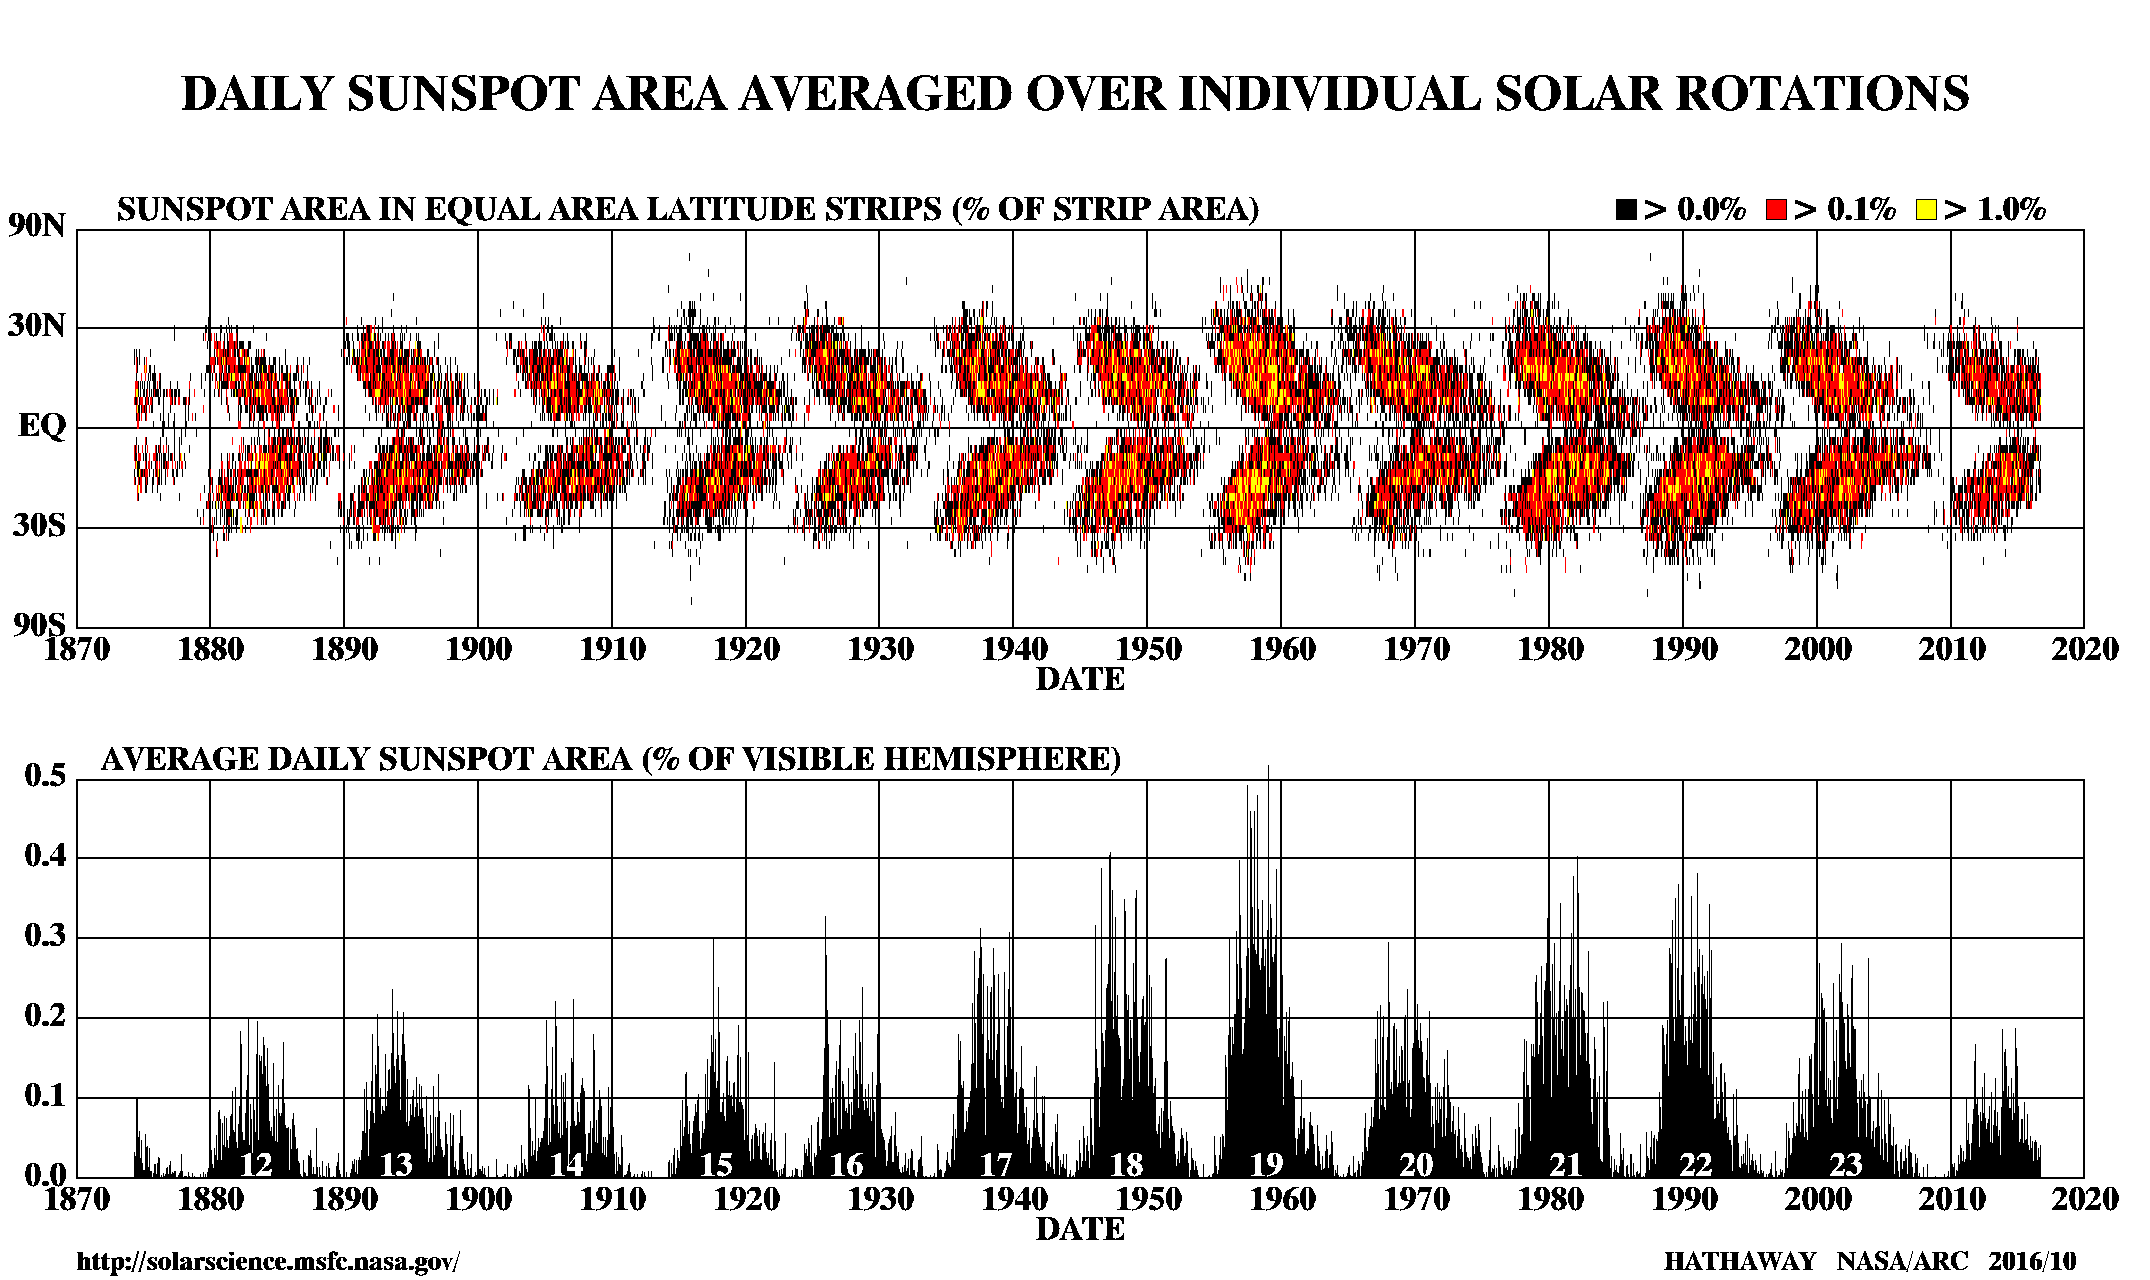
The current prediction for Sunspot Cycle 24 gives a smoothed sunspot number maximum of about 60 in the Spring of 2013. We are currently over three years into Cycle 24. The current predicted size makes this the smallest sunspot cycle in about 100 years.

The prediction method has been slightly revised. The previous method found a fit for both the amplitude and the starting time of the cycle along with a weighted estimate of the amplitude from precursor predictions (polar fields and geomagnetic activity near cycle minimum). Recent work [see Hathaway Solar Physics; 273, 221 (2011)] indicates that the equatorward drift of the sunspot latitudes as seen in the Butterfly Diagram follows a standard path for all cycles provided the dates are taken relative to a starting time determined by fitting the full cycle. Using data for the current sunspot cycle indicates a starting date of May of 2008. Fixing this date and then finding the cycle amplitude that best fits the sunspot number data yields the current (revised) prediction.
This matters if you believe that the sunspot cycle strongly effects the earth's climate.  Evidence suggests that in the past, the low sunspot cycles of the Maunder and Dalton minimums coincide with periods of cool average climate on Earth. Recent progression of the cycle suggests that the sun may be going into a minimum now, which may rival the Dalton minimum, and may reach the low levels seen in the Maunder minimum.

A mechanism for the relationship between the sunspot cycle has been proposed.  The solar magnetic field (also tied to sunspots) deflects cosmic rays from earth.  Cosmic rays, in turn, ionize atoms in the Earth's atmosphere, and help to seed clouds.  Thus, periods of low sunspots correlate to greater cloudiness, high albedo, and lower temperatures on Earth.

So far, every revision of the next solar cycle has been downward.  Will they earth's climate cool as solar activity recedes?  Stay tuned for further developments:

Previous posts on the solar cycle/climate link:

Japanese Scientists Warm of Cooling Climate 
A View from the Beach: Ain't No Sunspots...
Solar Magnetic Activity Linked to Climate Via Cosmic Rays
Solar Breakdown - AAS Predicts Solar Minimum
CERN Head Censors Scientific Thinking
Dalton or Maunder?
CERN Study Finds-Climate Cosmic Ray Link 


Found at Watts Up With That.

Tuesday, May 1, 2012

Wind Power Adds to Global Warming

Researchers used satellite data from 2003 to 2011 to examine surface temperatures across as wide swath of west Texas, which has built four of the world's largest wind farms. The data showed a direct correlation between night-time temperatures increases of 0.72 degrees C (1.3 degrees F) and the placement of the farms.

"Given the present installed capacity and the projected growth in installation of wind farms across the world, I feel that wind farms, if spatially large enough, might have noticeable impacts on local to regional meteorology," Liming Zhou, associate professor at the State University of New York, Albany and author of the paper published April 29 in Nature Climate Change said in an e-mail to Discovery News.
The effect seems to be largely due to mixing; at night, the wind turbines mix the cool layer of air close to the ground with warmer air above, resulting in warmer average temperatures at the surface.

Wind turbines also heat the air for another reason; friction and the 2nd law of Thermodynamics.  Wind is the sun's thermal energy converted (however inefficiently) to kinetic energy.  To capture that energy back from the wind using the wind turbines involves friction along the blades, and the conversion of that energy to electricity, all of which, by the 2nd Law, involve to loss of some of that energy as heat.

There have been a number of "gotcha" type articles on this in the skeptical media. Wind Power adds to Global Warming!  Oh Nooes!

I'm sympathetic to the viewpoint because the AGW side takes every bit of weather news, and turns it into a screed against Global Warming.  It gets extremely tiring to hear about the death of mountains because a few herbs have shifted their range vertically a fraction of a meter a year, or that home runs have become easier due to thinner air caused by global warming. The list of thing that have been blamed on global warming is just astonishing (and funny as hell).

So, while I tend to discount the importance of the warming of Texas due to Picken's Propellers, a little turnabout is fair play.